
Amazing Secrets of Resistance and Support Line in Advanced Chart Reading
-modified.webp)
The concepts of resistance and support are part of the foundations of technical analysis. Like trend lines, resistance and support convey assumptions about price patterns that are ambiguous. Just when is resistance or support broken ? When is resistance and support simply being probed ? Current technical analysis of resistance and support treat those concepts as firm and quantifiable. They are not. We can see the inherent ambiguity in finding resistance and support Price patterns such as triangles and channels are patterns that exhibit similar degrees of vagueness and are imprecise when the trader attributes powers to the patterns that they do not have to predict future price direction Keep in mind that the patterns, which are perceived by traders, are subjective and at best ex-post facto.

They are easy to see after they have formed. True patterns in nature are mathematical and can be tested by scientific methods. More importantly, they are inter subjective, which means that other people can confirm them. Price patterns are flawed because they are best-case interpretations. However, patterns do provide evidence of the status of emotions in the market.Fibonacci levels are among the most popular tools for trading and do give insight into the nature of price action. Although the field of technical analysis ascribes nearly magical powers to Fibonacci levels, they are still not reflective of any inherent direction.

When prices seem to move in Fibonacci retracement ratios it is because that is the way energy moves everywhere (the famous Nautilus shell is a classic illustration of Fibonacci patterns, and the proportions of the human face follow Fibonacci ratios), but this does not mean that they predict where the price is going. Furthermore, markets recognize where the Fibonacci points are and use them to create trading triggers. This creates a self-fulfilling process. Fib lines need to be seen as providing zones of possible resistance and support. The most important weakness in applying Fibonacci analysis relates to the confusion of where to locate a bounce or break off a fib line. This kind of thinking creates a lot of room for error. Just when can a break of a Fibonacci line be considered a break? A break is a very subjective concept. Do we consider a break when the price reaches above or below a Fib line? Or do we have to wait for a candle to close more than once above such a line? The answer may vary among different traders.
The body of technical analysis also includes popular tools such as indicators and moving averages. They have a major weakness in common: they are lagging indicators. The mathematics of their construction calculates past prices and transforms them using a variety of equations into an indicator number. They should be seen as training wheels for the new trader. As the trader gets more experienced, these wheels are taken off and the trader focuses on the price action itself. Instead, bad habits are hard to change and traders find themselves loading a chart with so many indicators that it looks like a Jackson Pollock painting!

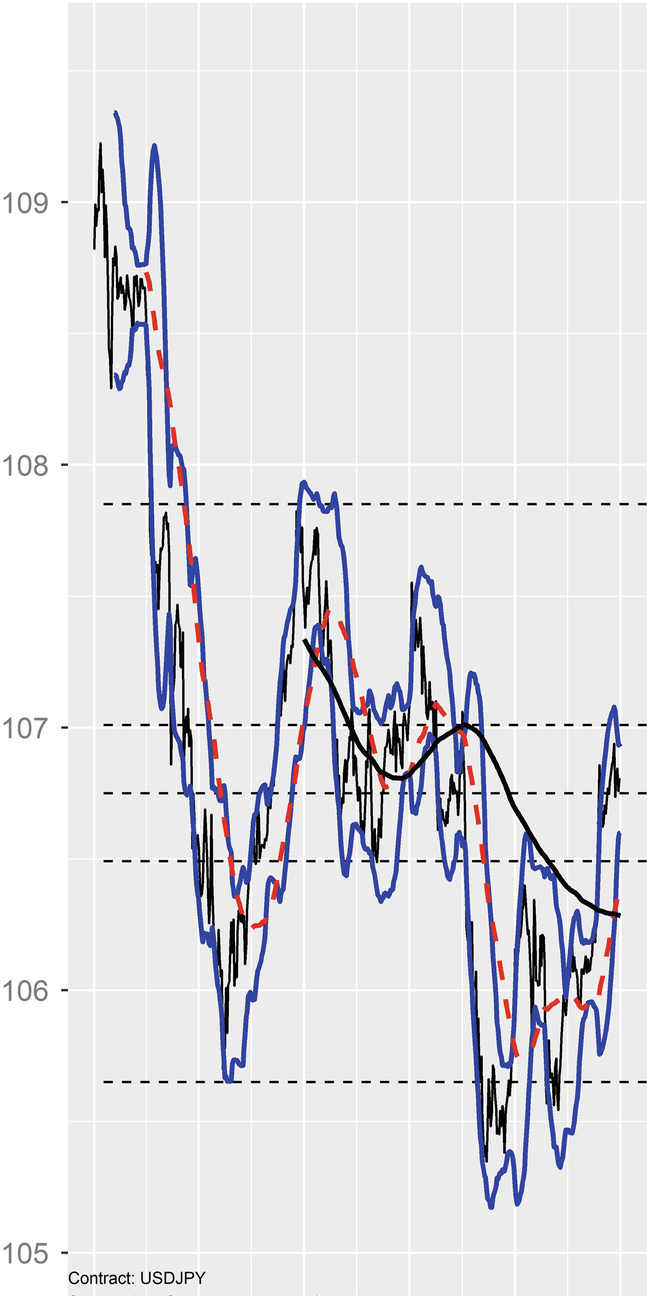
For the new trader, trade set-ups are a common way of starting to trade currencies. They typically offer a combination of different indicators. Bollinger Bands, Fibonacci lines, and moving averages, are very popular set-ups for new traders. They do have a use as they provide an initial framework for finding a trade signal. They promote, however, a key embedded weakness, which is ignoring the price action ! The trader focuses on the set-up which has a counterproductive impact; the signal gets obscured.
All forms of current technical analysis have in common the problem of egocentric myopia. Technical traders act as if the spot forex charts is all they have, and indeed all they need to be a profitable trader. The belief system of the technical trader is that prices sufficiently and fairly reflect anything the trader needs to know about the outside world. When technical analysis is exclusively relied upon, there is a likely failure of perception. Seeing a chart is not the same as perceiving the forces that are impacting the prices.
Of course, there is no perfect way to trade markets and currencies, but some mind-sets undermine the trader right from the start. Traders, especially beginners, who spend thousands of dollars on courses that have no real foundations of validity and are sold with hyperbolic promises, are prone to counterproductive behaviors. Having invested thousands of dollars, there is a natural bias toward believing in what was invested. For example, traders keep watching the charts, looking for a technical angle that will be the winning trading signal and a ride to profitability. The fact is that a chart maps current prices and previous movements. They do not reveal what caused the movement !
Ultimately, as traders become more experienced, they lose indicators and previous set-ups and focus on trying to understand why a price reached a certain point. The answer lies in understanding the fundamental forces that permeate the markets and diagnosing price action not as something that has a goal but is a signature of emotions. It is worthwhile to build a knowledge base of how emotions and markets and, in particular, currency pairs intertwine.
There is one more critical flaw in emphasizing technical analysis that needs to be raised: it ignores the human condition. Traders are told to eliminate emotion from trading. They are taught instead to rely on a set of rules and set-ups. But emotional intelligence is exactly what a successful trader needs to develop and apply. Learning a set-up and a trading technique is relatively easy. But learning how to deal with surprises in price action or a sequence of losses is a key survival skill that technical analysis completely ignores.
A trader that is experiencing acute stress, resulting from a persistent and lingering memory of a loss, is in fact in danger of further losses until the cycle of depression is broken by a big win. Perhaps the American Psychiatric Association should amend its latest Diagnostic and Statistical Manual of Mental Disorders (DSM-5) and investigate “Trader-related disorders !” Until then, traders should pay constant attention to their emotional state and, importantly, to the emotional state of the market.

About Kuldeep Nikam
.webp)


No comments