
What Are Harmonic Price Patterns?
-modified.webp)
Harmonic price patterns are a type of technical analysis pattern used by traders to identify potential trend reversals in financial markets.
These patterns are based on the idea that market movements are often predictable and follow specific geometric patterns.
There are several types of harmonic price patterns, but some of the most commonly used ones include:
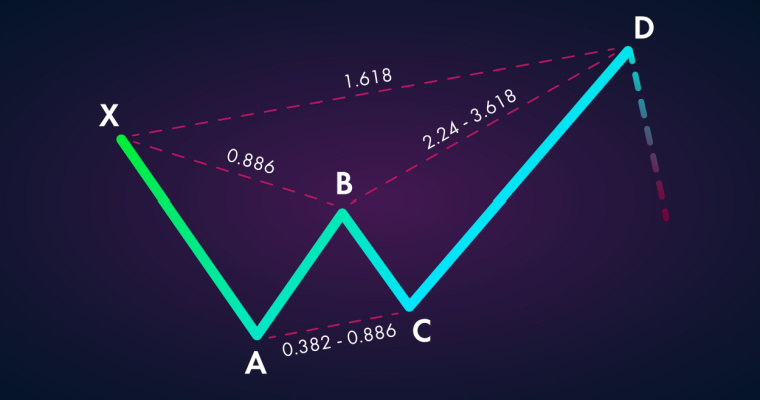
- 1. The Butterfly pattern: This pattern is formed by a series of price swings that converge at a specific point, forming the shape of a butterfly. The pattern is considered complete when the price action reaches a specific level, typically the 78.6% retracement of the initial move.
- 2. The Gartley pattern: This pattern is formed by a series of price swings that form an "M" or "W" shape. The pattern is considered complete when the price action reaches the 61.8% retracement of the initial move.
- 3. The Bat pattern: This pattern is similar to the Gartley pattern, but with a tighter range of price swings. The pattern is considered complete when the price action reaches the 88.6% retracement of the initial move.
Traders use these patterns to identify potential entry and exit points for trades, as well as to set stop-loss levels and profit targets. However, it's important to note that harmonic price patterns are not always reliable and should be used in conjunction with other technical and fundamental analysis tools.

About Kuldeep Nikam
.webp)


No comments